The number of homes for sale in the United States rose by 35% in August. This increase in inventory also led to a rise in the share of homes with price cuts.
Active listings in August grew by 35.8% nationwide, marking the 10th straight month home listings increased. It is also the highest share since May 2020, per data from Realtor. That being said, the growth slowed down from July, when the number of active listings increased by 36.6% in a year.
In addition, homes that were not sold also increased by 20.9% year-over-year. This includes homes that went under contract. The figure grew on an annual basis for the ninth consecutive month.
Supply increased the most in the Tampa-St. Petersburg-Clearwater metro area where inventory is up by 90.1% compared with a year ago. The growth of home listings was slowest in the New York-Newark-Jersey City area, where supply only rose 2.1% year-over-year.
Which Home Listings Grew the Most
Among all properties, homes priced from $200,000 to $350,000 grew the most in August. Listings of these houses increased by 46.1% compared to August 2023. It is the seventh consecutive month of increase in home listings in this price range, the report noted.
Despite the recent rise in home listings, the supply of homes is still 26% lower than pre-pandemic levels.
The share of new home sellers also fell. There were 0.9% fewer homes in the market in August than the year before.
Price Cuts Rose
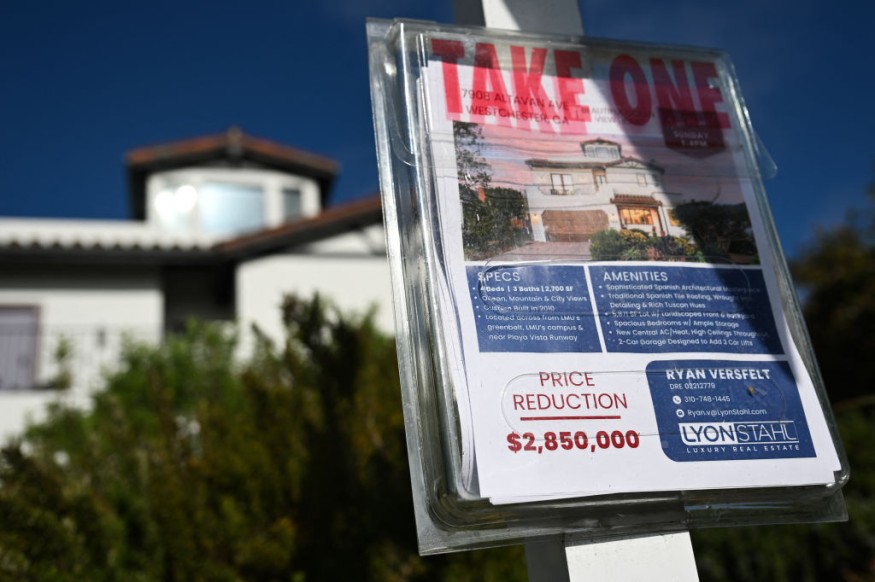
As home listings increased, the number of homes that saw price cuts also grew. In August, 19.3% of homes reported price reductions. This share was only around 16% in the same period last year.
Price cuts were seen in 47 of the 50 largest metro areas in the US, with Portland seeing the greatest increase at 10.6%.
By region, the share of homes that saw asking prices reduced was the largest in the West (3.5%). The Midwest followed closely with 3.3%, the South with 2.8%, and the Northeast with 2.0%.
© 2025 Realty Today All rights reserved. Do not reproduce without permission.


